
欢迎来到环球教育官方网站,来环球,去全球,名师高徒,高分留学!
来源:环球教育深圳学校
小编:袁媛 1005雅思小作文图表中极少会考到单个饼图,但是无论是两个饼图,还是三个、四个饼图,在考试时间极其有限的情况下,发现和总结规律是应对饼图的关键。
例如下图所示(以主体段为例分析)

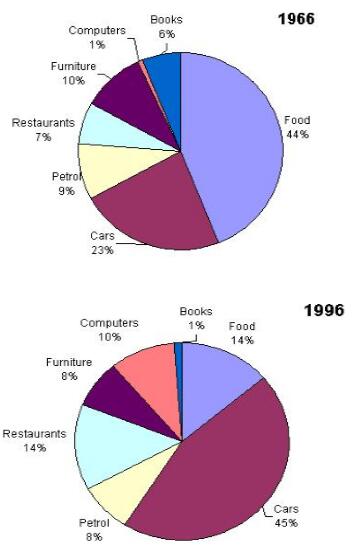
The charts below show US spending patterns from 1966 to 1996.
应对饼图,我们只需采用以下三个解题步骤(我称它为"饼图三步曲")
1)Present a Clear Overview 展示清晰的概貌
具体而言,观察每张饼图的各类别所占比例,并比较两幅图之间的关系。不难发现在这两个年份food和cars是占家庭支出的最大的两个类别并且food和cars的总和占家庭支出比例的半数以上。具体表达如下:
Food and cars made up the two biggest items of expenditure in both years. Together they comprised over half of household spending. Food accounted for 44% of spending in 1966, but this dropped by two thirds to 14% in 1996. However, the outlay on cars almost doubled, rising from 23% in 1966 to 45% in 1996.
2)Summarise Main Features 总结主要特征
比较相同类别在各饼图之间的比例变化(涉及趋势变化)。
除去food和cars,剩余的5类所占家庭支出的比例变化有上升也有下降趋势,有变化幅度大的也有变化幅度小的。如:
restaurants: 7%----14%
computers: 1%----10%
books: 6%----1%
petrol: 9%----8%
furniture:10%----8%
3) Make comparisons where relevant 相关数据作比较
理论上而言,按趋势和幅度分段写都是可以的,但为了数据信息处理更简便以及使表达上更精炼,我们在这里按变化幅度分段描述。
A. 变化幅度大的有restaurants, computers和books
Some areas changed significantly. Spending on restaurants doubled, climbing from 7% to 14%. The proportion of salary spent on computers increased dramatically from 1% in 1966 to 10% in 1996. However, as computer expenditure rose, the percentage of outlay on books plunged from 6% to 1%.
B. 变化幅度小的有petrol和furniture
Other areas remained relatively unchanged. Americans spent approximately the same amount of salary on petrol and furniture in both years.
因此,无论考试中遇到几个饼图,掌握了以上针对饼图的解题技巧,"以不变应万变",饼图便可迎刃而解。